Using Fluid Inclusions To
Explore For Oil And Gas
By
Don Hall
Wells Shentwu
Mike Sterner
Paul Wagner
Examining fluid inclusions in more than 20,000 core samples from 180 wells and analyzing the resulting data maps generated 39 oil and gas leads in the Gulf of Mexico within six weeks. A similar study would have taken labs with conventional instrumentation at least a year to complete.
Standard geochemical techniques that analyze residual pore fluids are often inadequate for determining where petroleum fluids have been, and are typically hampered by contamination, fractionation and alteration issues. Fortunately, subsurface fluid processes, such as migration of petroleum and charging of reservoirs, leave resolvable chemical traces in the form of crystallographically trapped fluids in diagenetic cements and healed microfractures. These fluid inclusions are generally faithful recorders of pore fluid chemistry and are not subject to evaporation during sample storage or loss of light ends during sampling from depth. They persist in the geologic record long after the parent fluids have moved on, but are continuously formed even up to the very recent past.
A new analytical method, fluid inclusion stratigraphy (FIS), allows past and near-present-day pore fluids, trapped as fluid inclusions, to be chemically characterized in drill cuttings, cores or outcrop material. This novel mass spectrometric technique is capable of evaluating thousands of samples in a matter of days, thereby enabling whole-well stratigraphic mapping of fluid chemistries. Coupled with other complementary fluid inclusion technologies, the process provides unique solutions to a variety of exploration and production questions.
Fluid Inclusions: Micron-Sized Sealed Pores
Fluid inclusions represent pore fluids that become trapped and completely isolated from the parent fluid during occlusion of intergranular porosity by diagenetic cements or healing of microfractures. Generally, these inclusions are localized by imperfections in the growing or healing crystals, including actual crystallographic defects, growth-poisoned grain surfaces and mismatches across fracture aperatures (Fig. 1). Additionally, old fluid inclusion cavities can be ruptured and refilled with new fluids, and the drilling process itself can create "drilling-induced" fluid inclusions. A continuum in fluid inclusion sizes exists, from individual volatile molecules trapped at dislocations to enormous fluid cavities visible with the naked eye. Generally, fluid inclusions in sedimentary rocks are in the 2-20 micron range and are classically studied with polished thin section preparations.
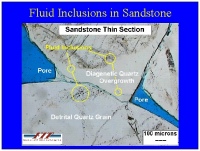
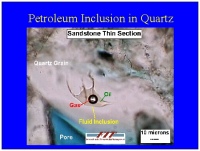
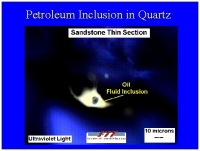
Fig. 1. Photomicrographs illustrate: (a) a thin section of sandstone with original detrital quartz grains, quartz overgrowths formed during burial diagenesis, and fluid inclusions as dark specks; (b) an oil fluid inclusion in quartz; and (c) the same oil inclusion fluorescing under ultraviolet illumination. Click on image for larger version.
During the evolution of a sedimentary basin or a petroleum reservoir, mineral cementation and fracturing are episodic, but continuous. Hence, multiple fluids are generally recorded in the fluid inclusion record and can be used to investigate organic and inorganic fluid histories over geologic time. Petroleum fluid inclusions can be found along hydrocarbon migration pathways, within present-day petroleum reservoirs, within petroleum reservoirs that have been flushed or have leaked, and within mature source beds.
The identification and study of petroleum inclusions has historically been accomplished through visual petrography of thin sections vertically illuminated with ultraviolet light (Fig. 1). While critical to any inclusion study, relying on this technique alone:
- Requires that thin sections be prepared from each zone of interest.
- Provides only the most basic chemical information on the trapped fluid phase.
- Cannot be applied to dry gas inclusions because they do not fluoresce.
Additionally, optical-based fluid inclusion techniques are usually too slow for regional evaluation and are not easily applied to mapping projects or large field studies.
Mapping Subsurface Fluids
To meet the need for rapid analysis of fluid inclusions in large numbers of samples, Amoco Production Research developed and patented the FIS technique. FIS is the quadrupole mass spectrometric analysis of bulk fluid inclusion volatiles. The unique, automated system allows large sample sets to be evaluated, facilitating the stratigraphic viewing of paleofluid chemistries throughout the drilled section at any sampling scale desired.
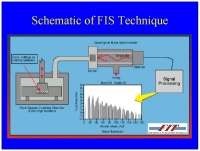
A schematic of the FIS technique is shown in Fig. 2. Well-washed rock samples are freed of volatile surface petroleum contamination, placed into a sample chamber and evacuated with turbomolecular pumps until water and hydrocarbon background have been reduced to an acceptable level. Samples are then sequentially positioned and bulk fluid inclusion volatiles are liberated by instantaneous mechanical crushing. Released volatiles are dynamically pumped through four quadrupole mass spectrometers where molecular compounds are ionized, separated according to their mass-to-charge ratio (m/z), amplified by electron multipliers and electronically recorded. Fragments with m/z of 2-180 are measured, including petroleum species with up to 13 carbon atoms and all geologically relevant inorganic gases, such as CO2, He and H2S. The assignment of particular mass ranges to each of the four spectrometers allows compounds with abundance range of six orders of magnitude to be detected and processed.
 Click on image for larger version.
Fig. 2. Shown is a schematic of the FIS technique.
About 2,400 samples (nearly eight, 10,000-ft wells sampled at 30-ft intervals) can be analyzed in a 24-hour period with two instruments. Analyses provide the information necessary for stratigraphic evaluation of paleofluid chemistries on a basin-wide scale; hence the term fluid inclusion stratigraphy. As an example of how rapidly these data can be generated, spectra were recently collected within 6 weeks on more than 20,000 samples from 180 wells offshore Texas in the Gulf of Mexico. Analysis of these data generated 39 oil and gas leads. A similar study would have taken labs with conventional instrumentation at least a year to complete.
Once collected, FIS data provide basic information on the distribution, chemistry and abundance of petroleum inclusions within the subsurface. These data can be used to identify:
- Bypassed and low-resistivity pays.
- Undrilled pays near the well bore.
- Original oil-water contacts in produced fields.
- Reservoir compartments.
- Seals.
- Hydrocarbon product type and quality.
- Hydrocarbon migration pathways.
Pay, Bypassed Pay and Low-Resistivity Pays
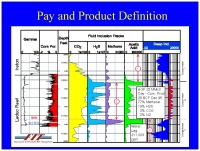
With appropriate local calibration, FIS can be used to delineate and characterize present-day petroleum-water contacts or transition zones, thereby aiding in reserve calculations, well testing decisions or well completion strategies. The technique has also been successful in delineating bypassed pay and low-resistivity pay intervals. These data have proved particularly powerful when provided during drilling.
An example of FIS pay delineation comes from a Devonian sour gas-bearing reef (Leduc formation) in the Western Canada Sedimentary Basin (Fig. 3). The top of the reef (top of pay) and gas-water contact are obvious in FIS analysis of cuttings as increases in methane, H2S, CO2 and acetic acid (+/- COS). The aquifer is indicated by lower fluid inclusion responses which correlate with sharply decreased induction resistivities.
 Click on image for larger version.
Fig. 3. FIS defines sour gas pay in a Leduc reservoir, Canada.
Undrilled Pays Near The Borehole
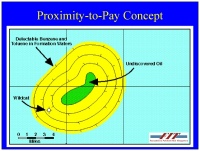
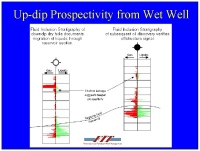
FIS documents stratigraphic intervals containing high levels of benzene, toluene and organic acids, which have been empirically found to be geomentrically connected to petroleum accumulations. The anomalies are thought to represent diffusive transport of water-soluble organic compounds away from the accumulation through intervals of high water saturation such as water legs, seals or waste zones (Fig. 4b). Documentation of these intervals in dry holes is significant and suggest that additional exploration is warranted in the area.
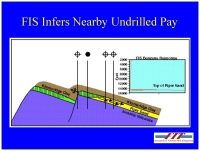
An example application from the North Sea is presented in Fig. 4a. Six years before Scott Field was discovered, the 15/22-3 exploratory well encountered a faulted-out section where Piper Sand pays were expected. Further exploration was halted for years. Had FIS data been available, proximity to pay signals would have been observed in shales separated from pay sands by faults. Sidetracking or new exploration wells would have been suggested. Proximity to pay signals are also observed in the downdip water leg sands to this field.
 Click on image for larger version.
Fig. 4a. Shown is a schematic cross section through Scott Field, North Sea, with arrows illustrating the presence of proximity-to-pay indicators within FIS data.
 Click on image for larger version.
Fig. 4b. Shown is a schematic of the halo effect of water soluble hydrocarbons around an undiscovered oil accumulation.
Original OWC In Disturbed Fields
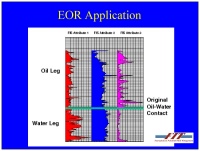
Another petroleum-water contact application is shown in Fig. 5. This well is from a mature field which is a candidate for enhanced oil recovery. It was determined that the field should be waterflooded to a depth corresponding to the original oil-water contact; however, the field was incrementally deepened, fluid contacts were disturbed by initial production and minimal log suites were available. Using archived cores or cuttings, FIS clearly documents the desired contact in this area by variation in selected ratios among organic compounds. It is suggested that this contact could be rapidly and cost-effectively mapped field-wide for all available wells as part of tertiary recovery planning.
 Click on image for larger version
Fig. 5. Data from a mature field well illustrate the ability of FIS to delineate original fluid contacts for EOR applications.
Reservoir Compartments
In compartmentalized reservoirs, fluid movement is restricted and individual compartments have an opportunity to evolve along discrete chemical paths. FIS has been used on tightly sampled cores to identify compartments within reservoirs and intra-reservoir baffles or seals. Some FIS trends can be correlated with porosity.
Seal Identification
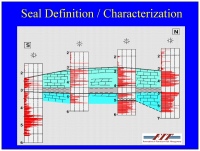
FIS can be used to identify regional or local seals to vertical or lateral hydrocarbon movement. Furthermore, some general observations about seal quality and character can be made. The following example from the Middle East serves as an illustration (Fig. 6).
FIS methane response vs. depth is shown for several wells along a transect. A regional shale seal generates low methane responses within these wells, as compared with the bounding carbonate units, suggesting that large quantities of petroleum have not moved across the unit. Additional FIS data suggest that petroleum inclusions within the two carbonates are distinct in chemistry, possibly due to different migration histories or different source rocks.
 Click on image for larger version.
Fig. 6. The regional seal between two regionally productive carbonate reservoirs is clearly delimited with FIS.
Predicting Petroleum Type And Quality
FIS provides basic information on product type. The distribution and abundance of individual compounds, along with specific compound ratios allow empirical distinction among dry gas, wet gas, condensate and oil. Additionally, some aspects of petroleum quality can be identified, such as biodegraded oil or sour gas. These variables were used in a recent study of offshore Texas wells to high-grade areas of liquids potential and deep condensate potential. Sour gas risk has also been effectively assessed using FIS in the Alberta Basin and the Cotton Valley Reef Trend.
Defining Petroleum Migration Routes
The Madeleine No. 1 well was drilled in 1969 on the Northwest Shelf of Australia with no mudlogging or electric log shows. However, FIS data indicate a strong liquid hydrocarbon show in the reservoir sand (Fig. 7). Coupled FIS and structural analysis at the time would have indicated updip liquid hydrocarbon potential. Twenty years later, the Wanaea No. 1 discovery well was drilled in an updip position and test at 5,856 b/d of oil and 3.8 MMcfd of gas. FIS data indicate updip liquid petroleum should be in the range of 45-50 o API; Wanaea produces 49 o API liquids.
The Wanaea field example illustrates a classic exploration application of FIS. Given an untested or improperly-tested structure and limited well control, fluid inclusion technologies can document migration of petroleum, product type and timing, thereby lowering exploration risk for these variable.
 Click on image for larger version.
Fig. 7. FIS data from Madeleine No. 1 drilled downdip to the Wanaea Field 20 years prior to its discovery clearly identify the top of the pay.
Conclusions
Fluid inclusions are micron-scale, mineralogically sealed samples of formation fluids trapped during petroleum migration and reservoir evolution. They are the only unaltered samples of past fluids, and many times are found to be representative of current reservoir petroleum.
Rapid chemical analysis of hundreds of samples from drill cuttings or cores, even those archived for decades, provides a nearly continuous stratigraphy of subsurface paleofluid and recent fluid chemistry. This information can be used to delineate the past and present distribution of petroleum in the subsurface, address seal issues and look for proximal pay zones.
Complementary fluid inclusion technologies using the advantage of FIS as a geochemical screening tool can provide information on API gravity of liquid petroleum, temperatures and pressures of petroleum migration and reservoir filling, oil-to-source-rock correlation, maturity, distinction between biogenic and thermogenic gases, and other valuable information.
About The Authors
- Wells Shentwu is the vice president of operations for Fluid Inclusion Technologies Inc. Previously, he was an analyst with Amoco Production Co. where he was also involved in development of FIS technology. He has a BS in management information systems from Central State University, Oklahoma.
- Mike Sterner is the vice president of R&D for Fluid Inclusion Technologies Inc. Previously, he was a senior research scientist at Pacific Northwest Laboratory where he was involved in thermodynamic modeling of electrolyte solutions. He has a BS in chemistry from the University of Michigan and a PhD in geology from Virginia Tech.
- Paul Wagner is a senior staff geologist with PGS Reservoir. Previously, he was a senior staff geologist with Amoco Production Co. where he investigated petrologic and geochemical aspects of fluid-rock interaction in sedimentary basins. He has a PhD in geology from Brown University.
For additional information contact
Sean Emel at s.emel@continental-labs.ab.ca
Continental Laboratories Ltd.
3601A 21st Street N.E.
Calgary, Alberta Canada
(403) 250-5125
Fax (403) 291-9556
Copyright © Continental Laboratories Ltd.. All rights reserved ( Legal Notice )
Technical Papers Corporate Profile Well Log Library Geoprint Software Links
Services Fluid Inclusion Analysis
This page last updated on October 13, 2005